Spatial Evolution of Solar Wind Discontinuities in the Outer Heliosphere: JUNO and 1AU-missions Observations
Introduction
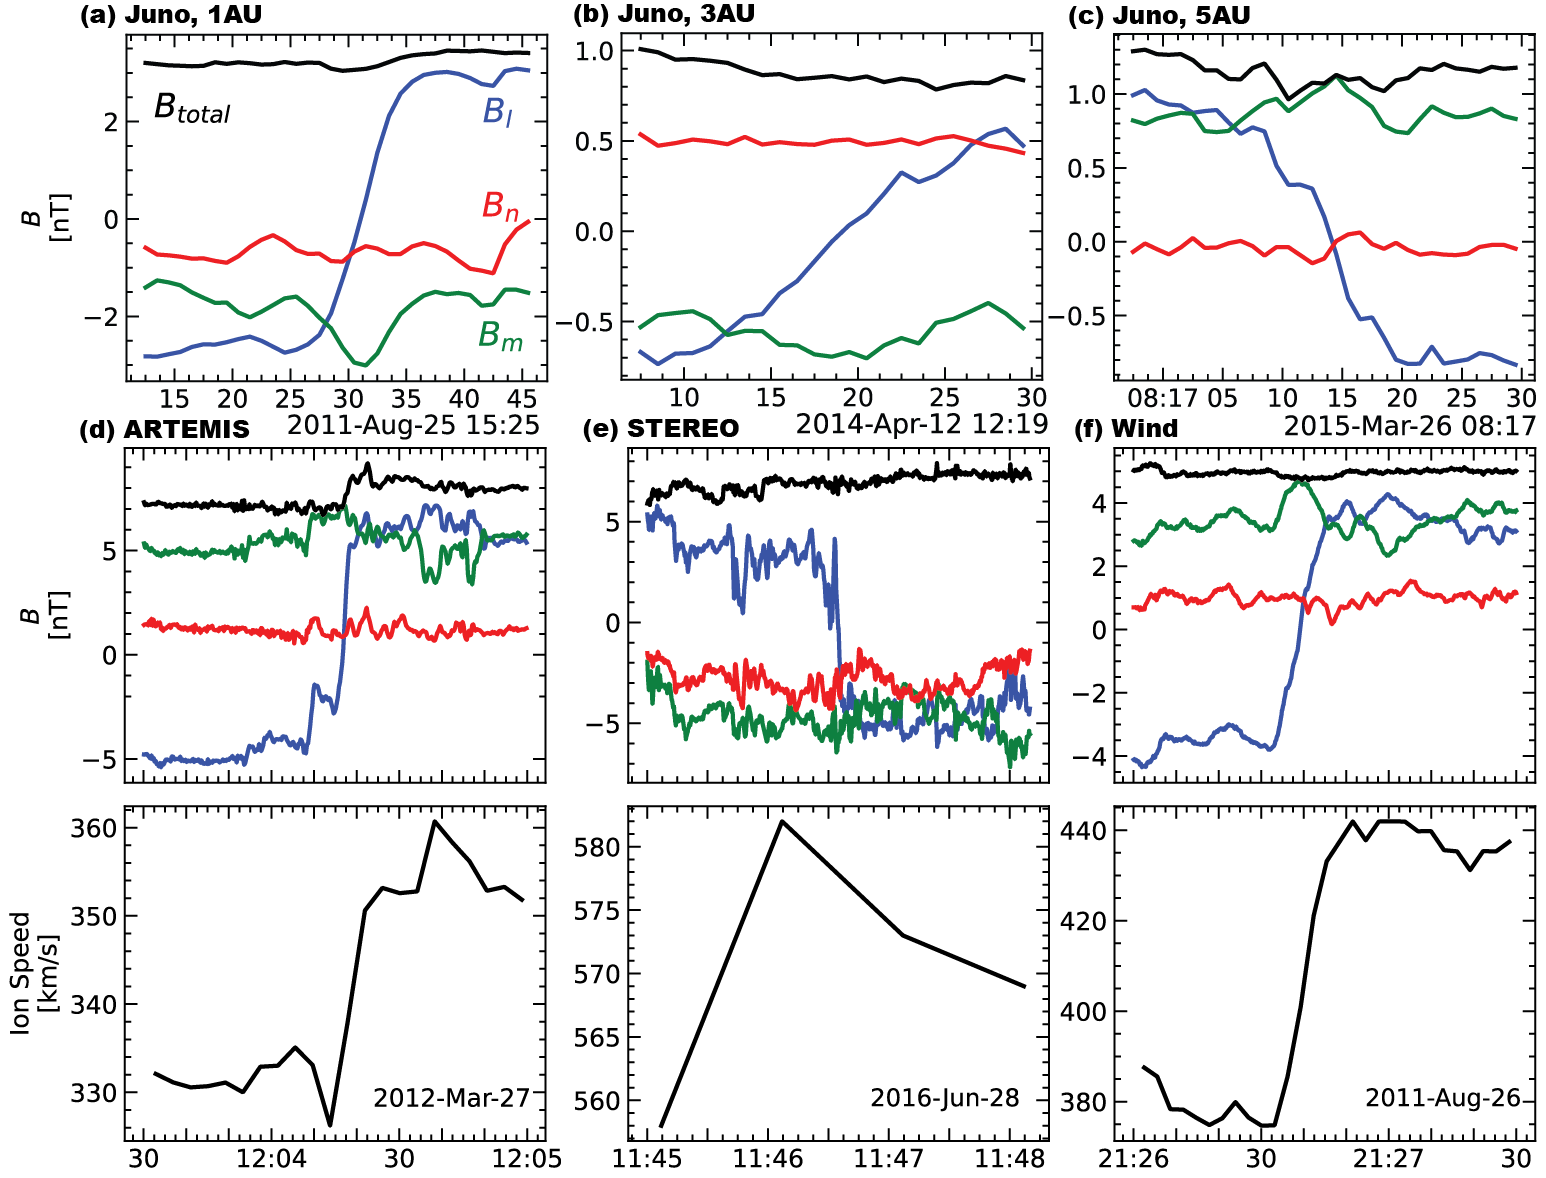
“Discontinuous changes in plasmas parameters and magnetic fields”
Motivation
How do solar wind discontinuities evolve over radial distances from the Sun?
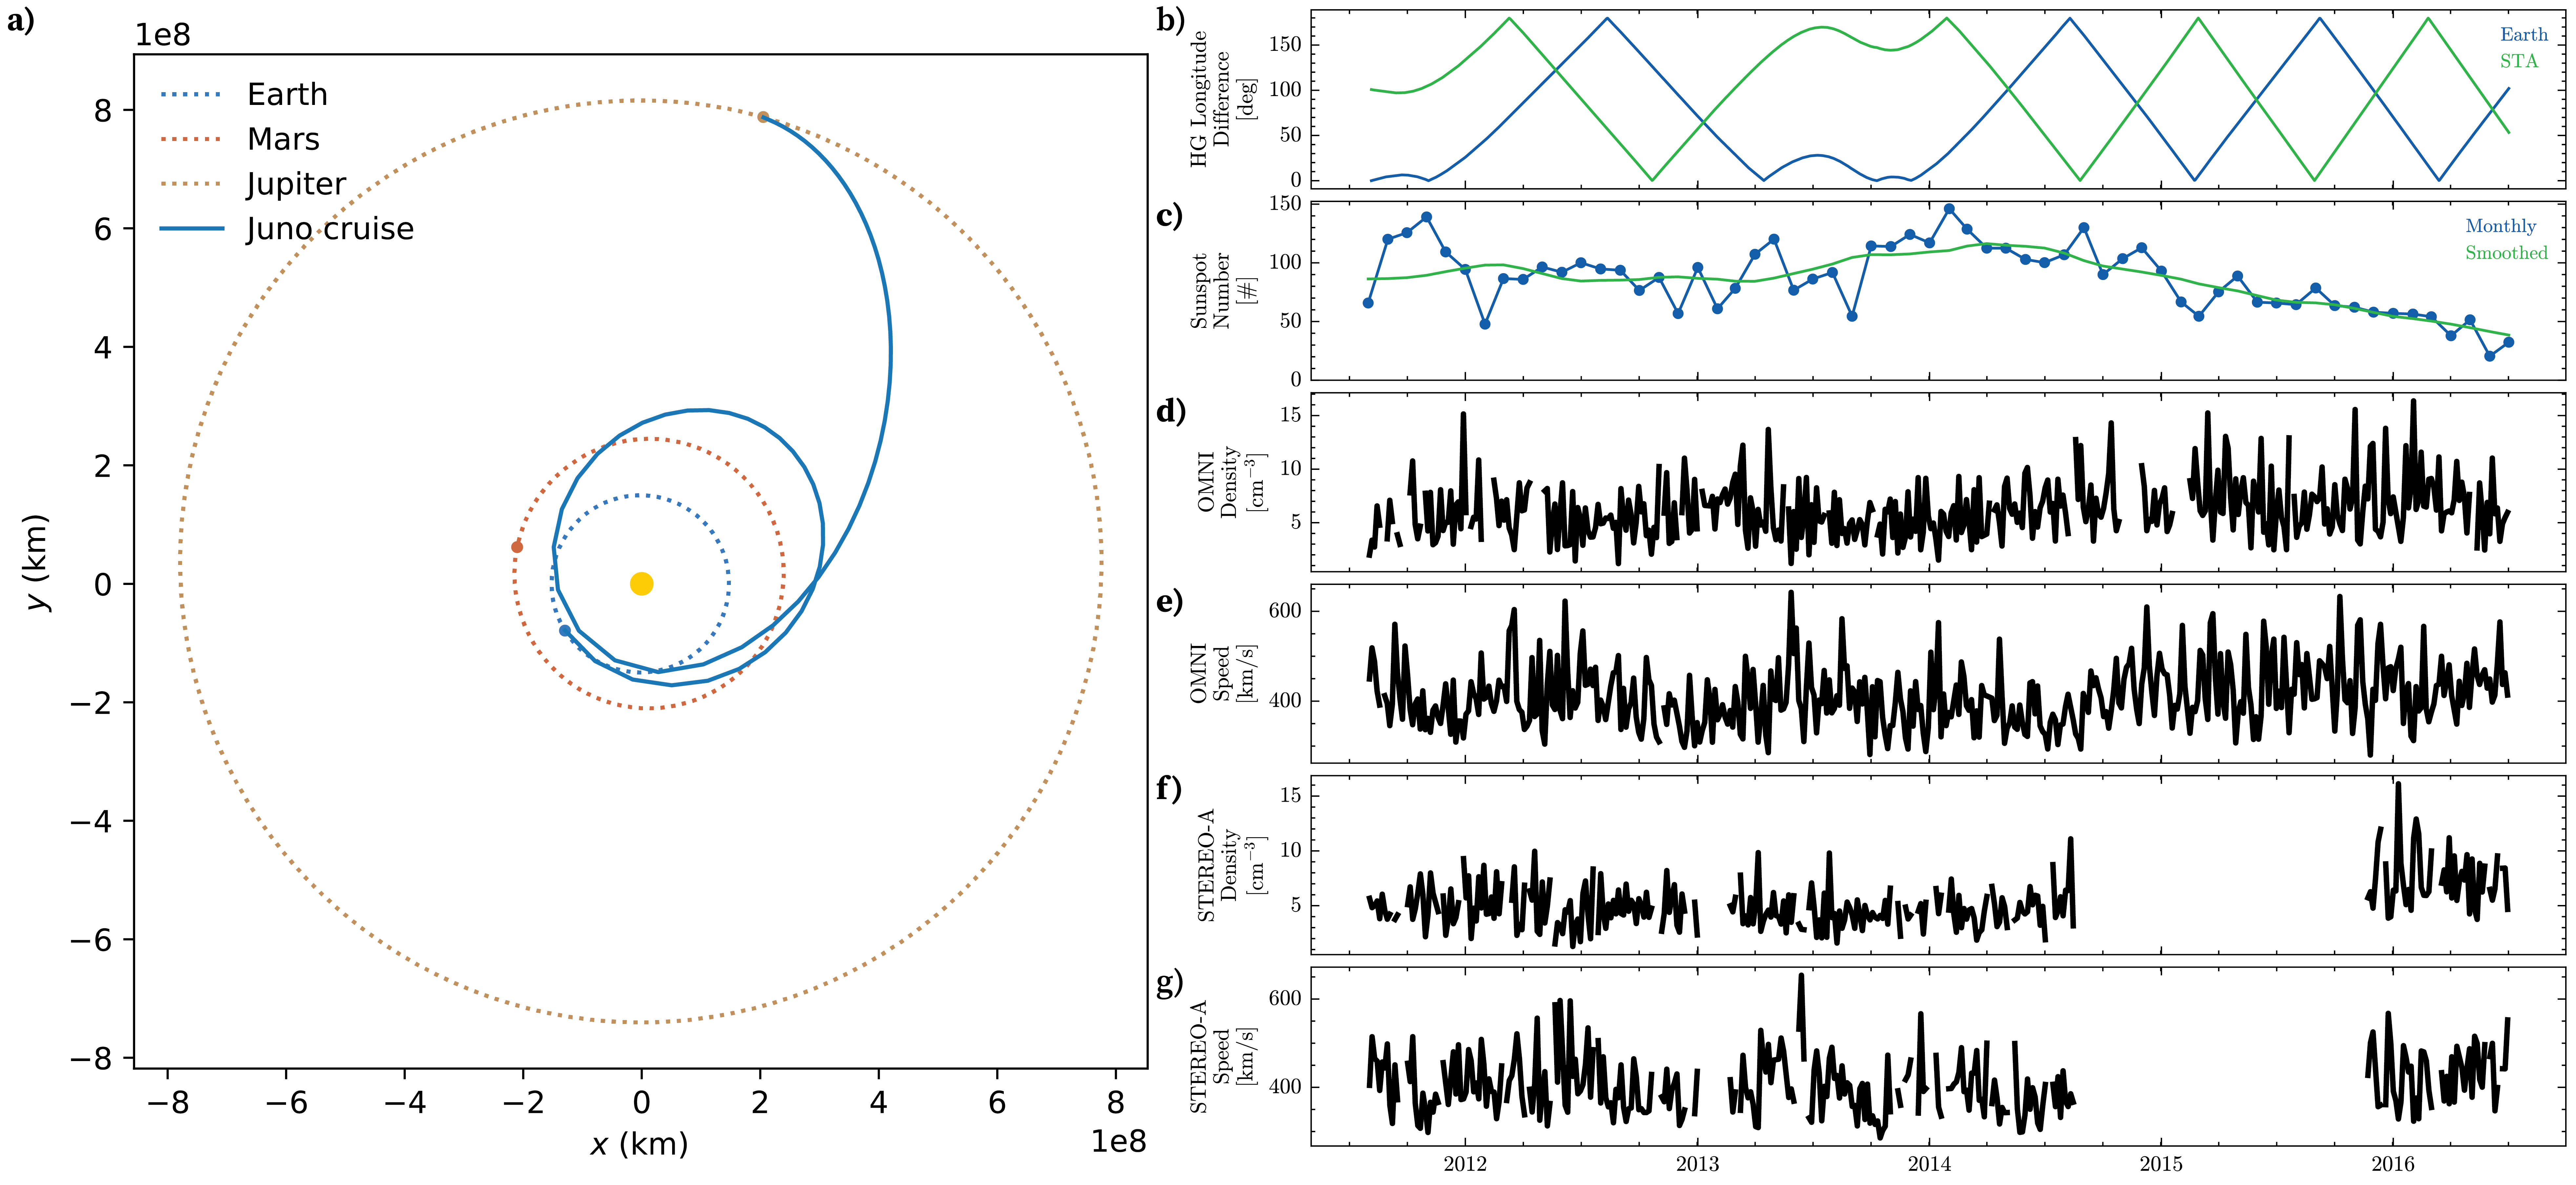
Juno during its five-year cruise phase (2011-2016) to Jupiter provides a unique opportunity!
=> What are the physical mechanisms behind their formation and evolution?
Overview
During the initial phase of the JUNO mission, the sunspot number reached its peak, indicating a period of heightened solar activity. However, by the end of the mission’s cruise phase, there was a significant decline in solar activity. This variation underscores the importance of calibrating the discontinuity properties in relation to solar activity levels to account for temporal fluctuations.
Temporal variations of SWDs
The change in the current density could be explained by the change in the solar wind properties with the solar cycle, as shown in Figure 4. Density and magnetic field asscoiated with the discontinuities increases with the solar cycle approaching the solar minimum, which could lead to the increase of the current density of the discontinuities with fixed normalized current density.
Dataset
| Mission | δt(B) | δt(plasma) |
|---|---|---|
| Juno | 1 Hz | 1 hour |
| ARTEMIS | 5 Hz | 0.25 Hz |
| WIND | 11 Hz | 1 Hz |
| STEREO | 8 Hz | 1 min |
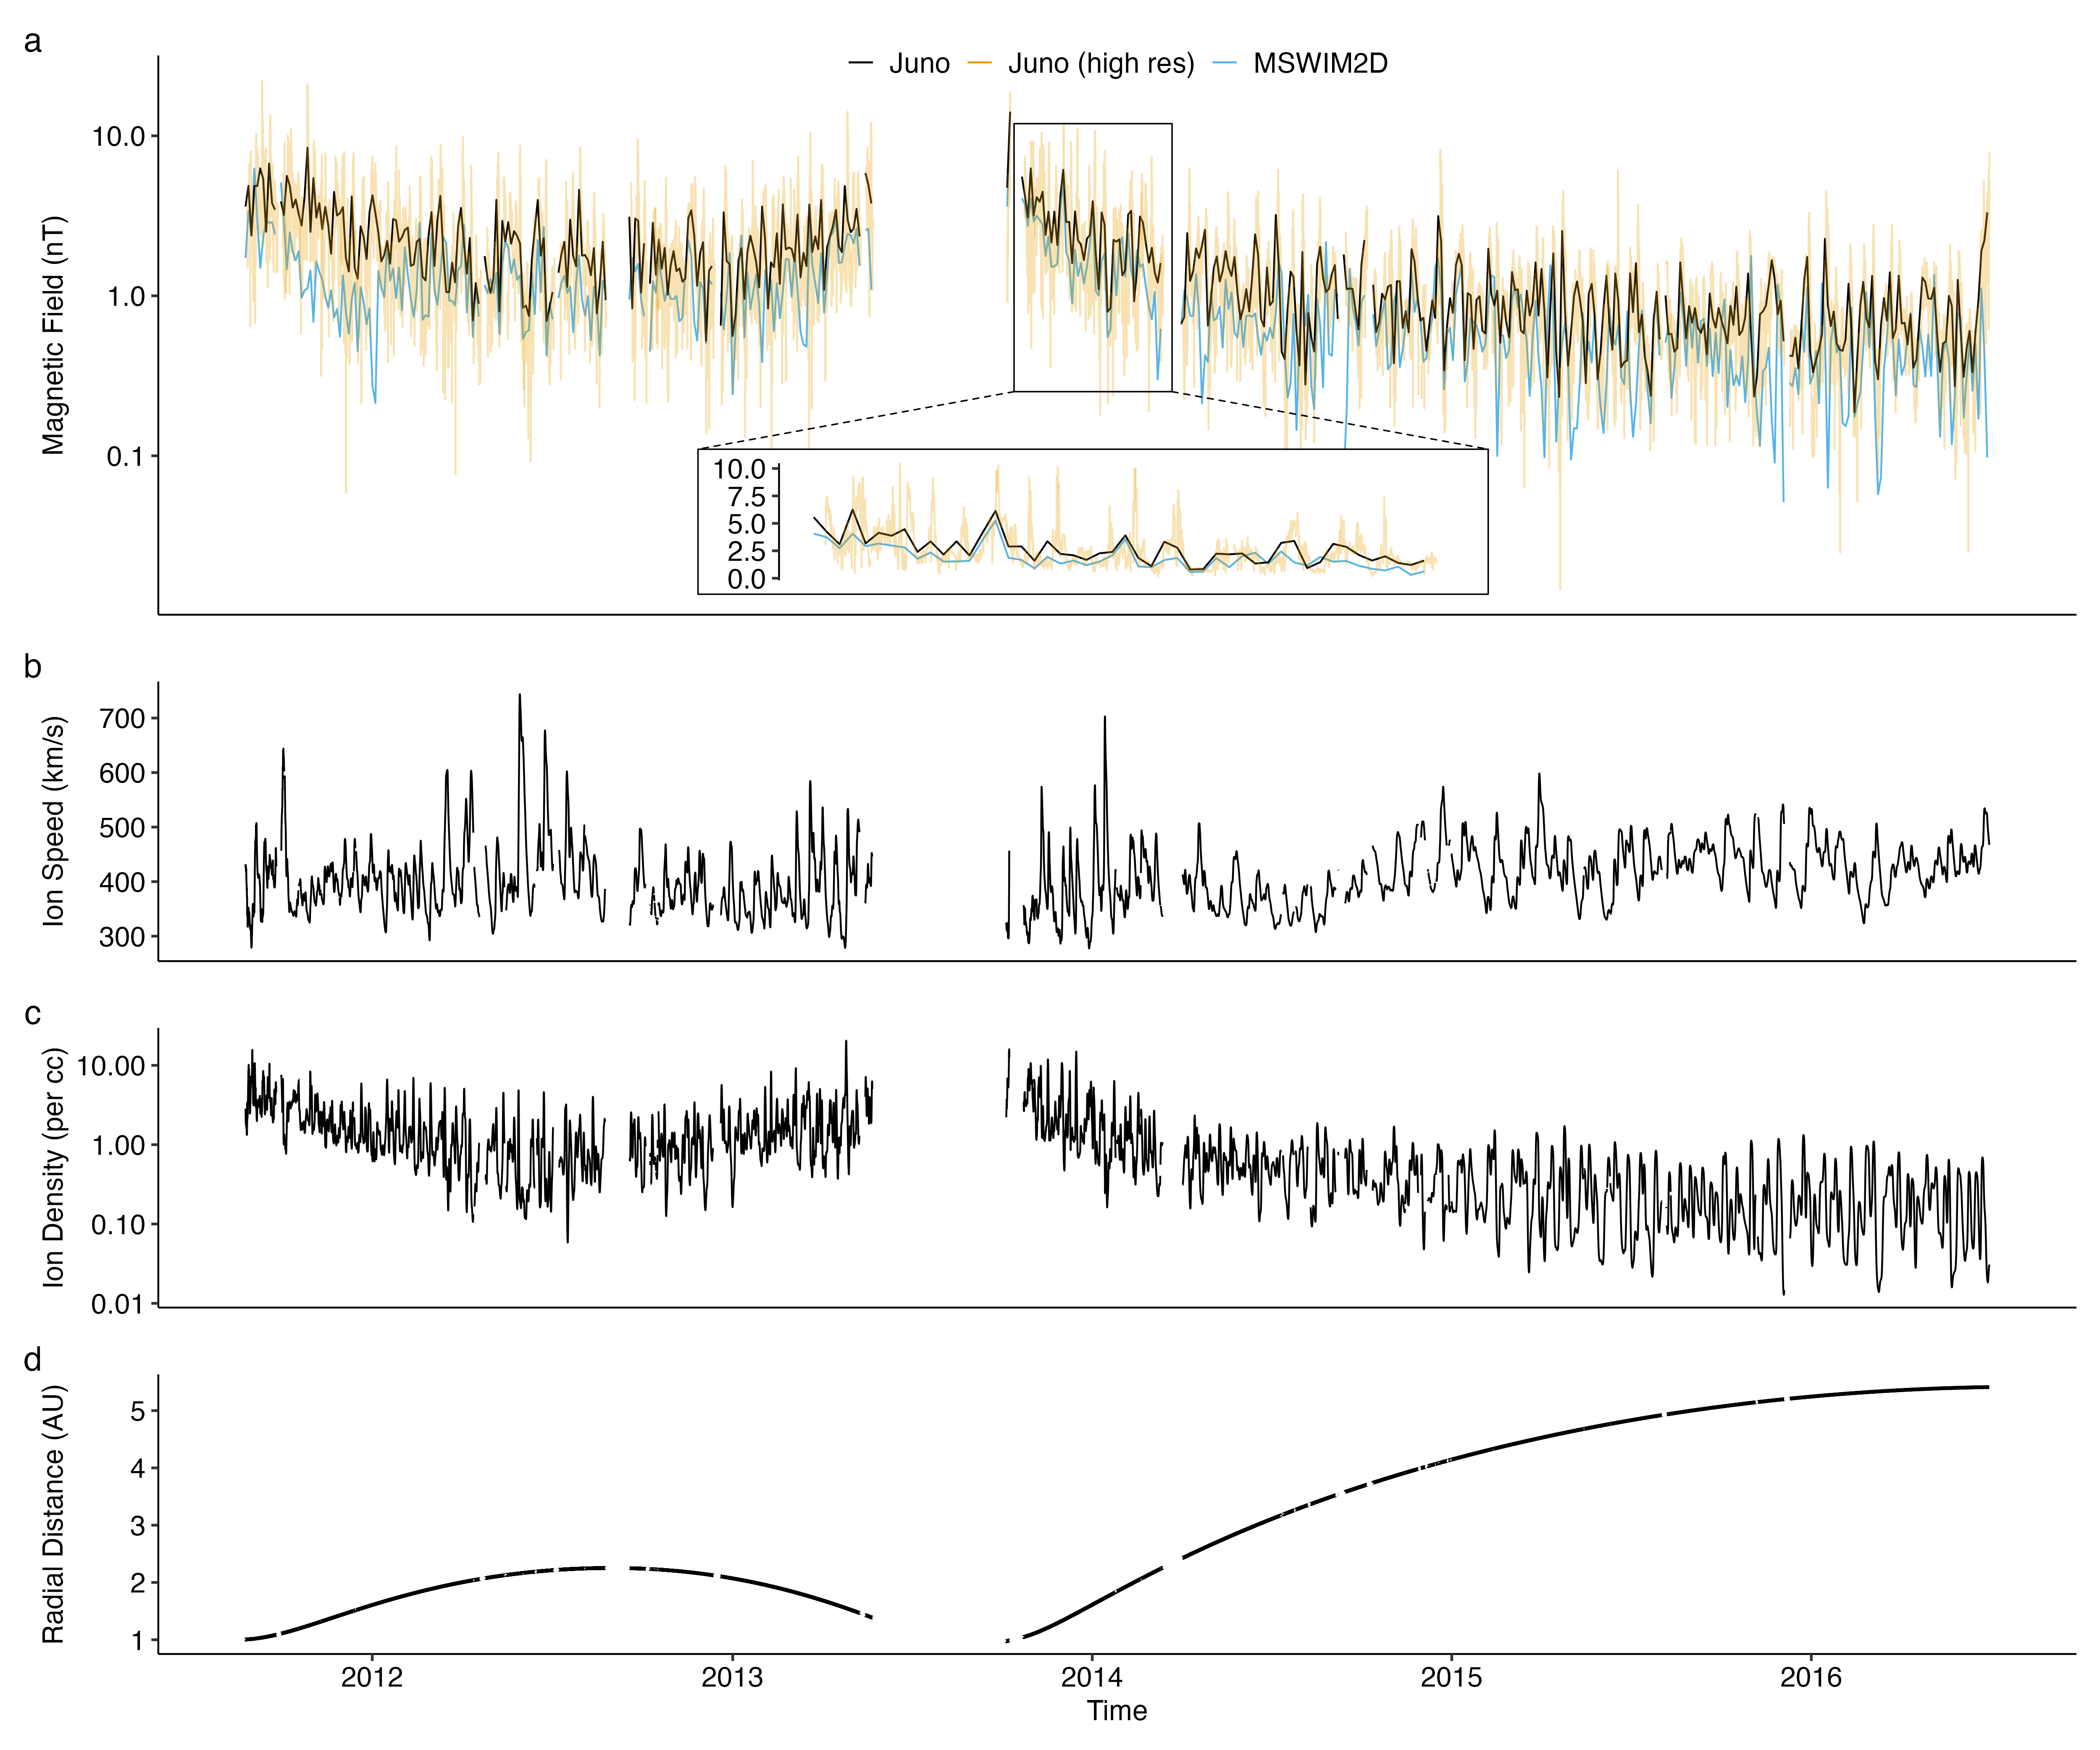
However, since Juno does not provide direct plasma measurements, we will estimate the spatial scale (thickness) of discontinuities using solar wind speed derived from solar wind propagation models. Specifically, we will employ the Two-Dimensional Outer Heliosphere Solar Wind Modeling (MSWIM2D) (Keebler et al. 2022) to determine the ion bulk velocity (\(v\)) and plasma density (\(n\)) at Juno’s location. This model, which utilizes the BATSRUS MHD solver, simulates the propagation of solar wind from 1 to 75 astronomical units (AU) in the ecliptic plane, effectively covering the region pertinent to our study. The MSWIM2D model provides output data with an hourly time resolution as shown in Figure 5. The comparison of magnetic field magnitudes from MSWIM2D with those measured by Juno, after averaging to the same time resolution, reveals a strong correlation, confirming the model’s reliability.
Results - Occurrence rate
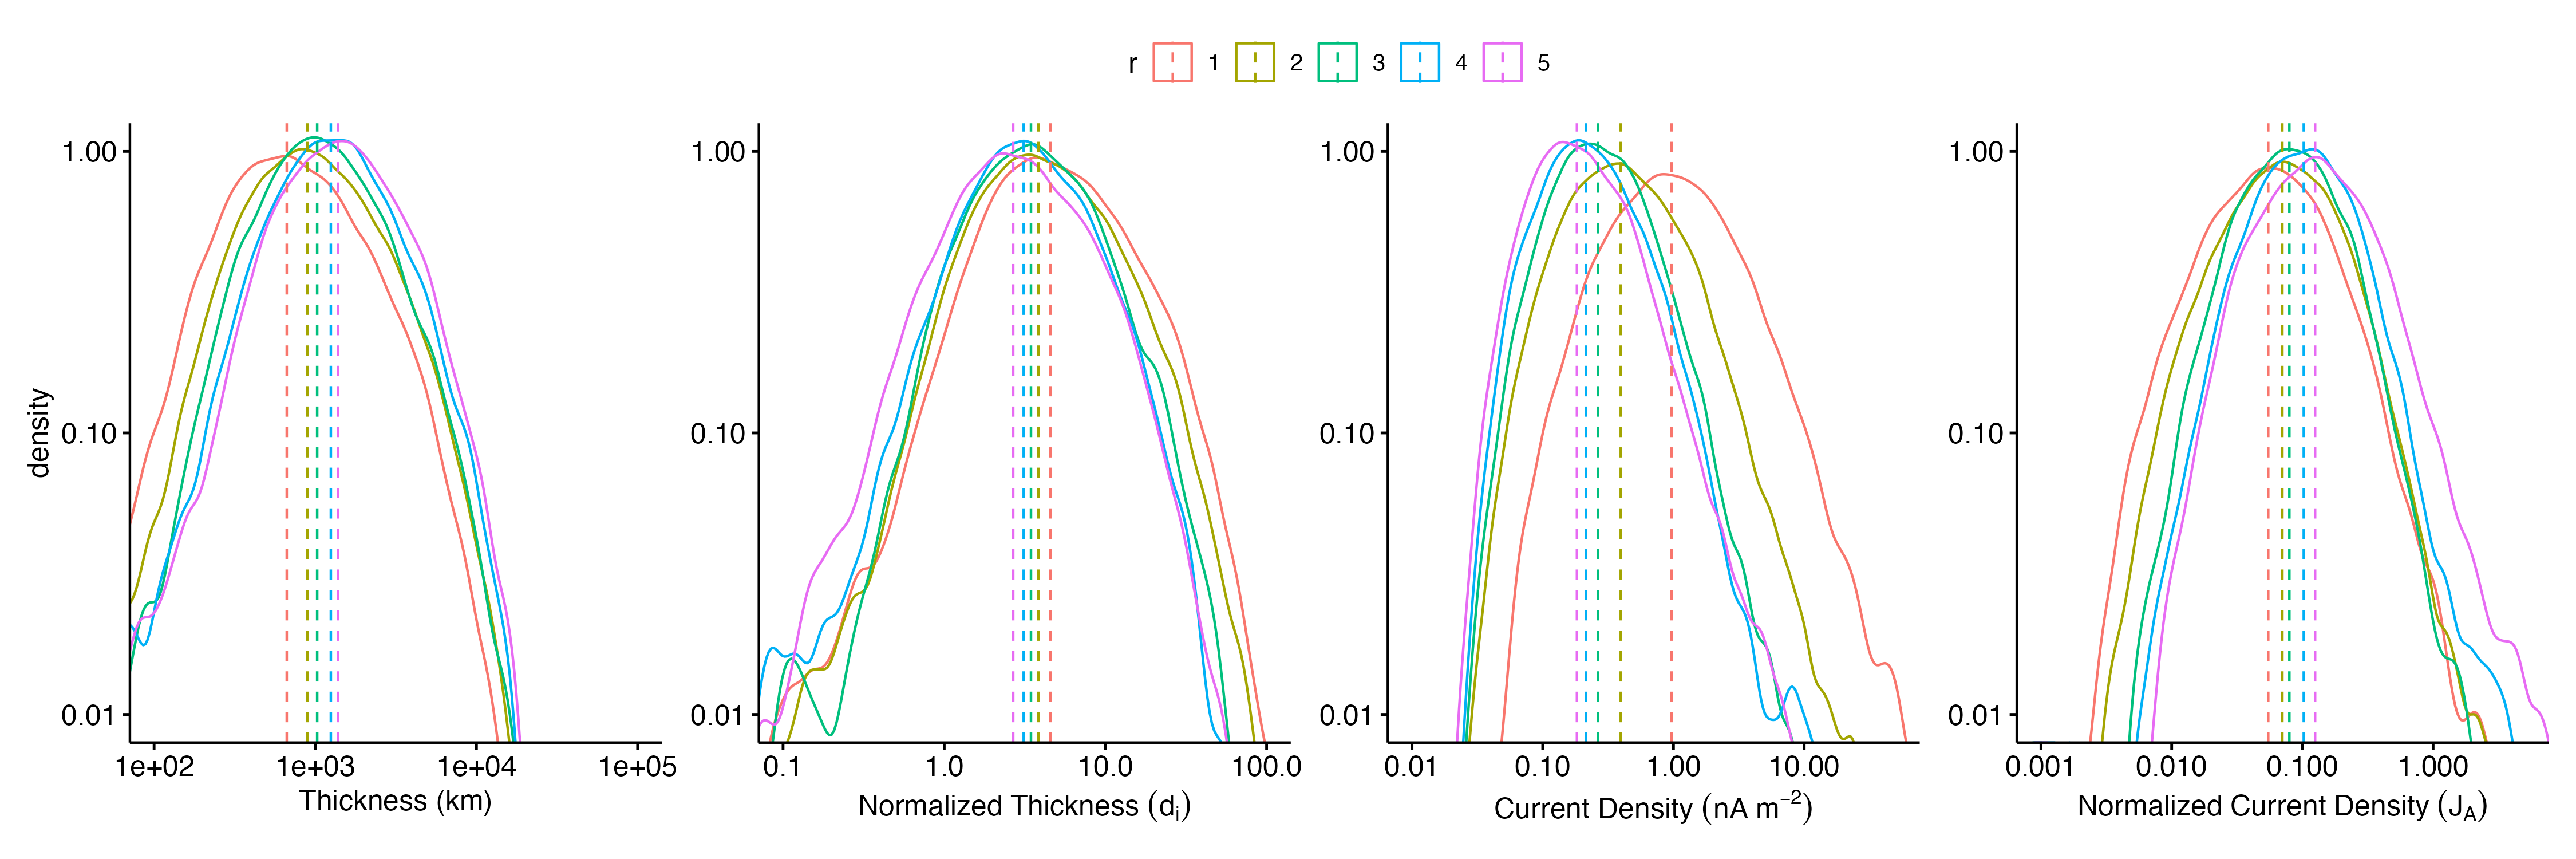
Results - Current density and thickness
Conclusion
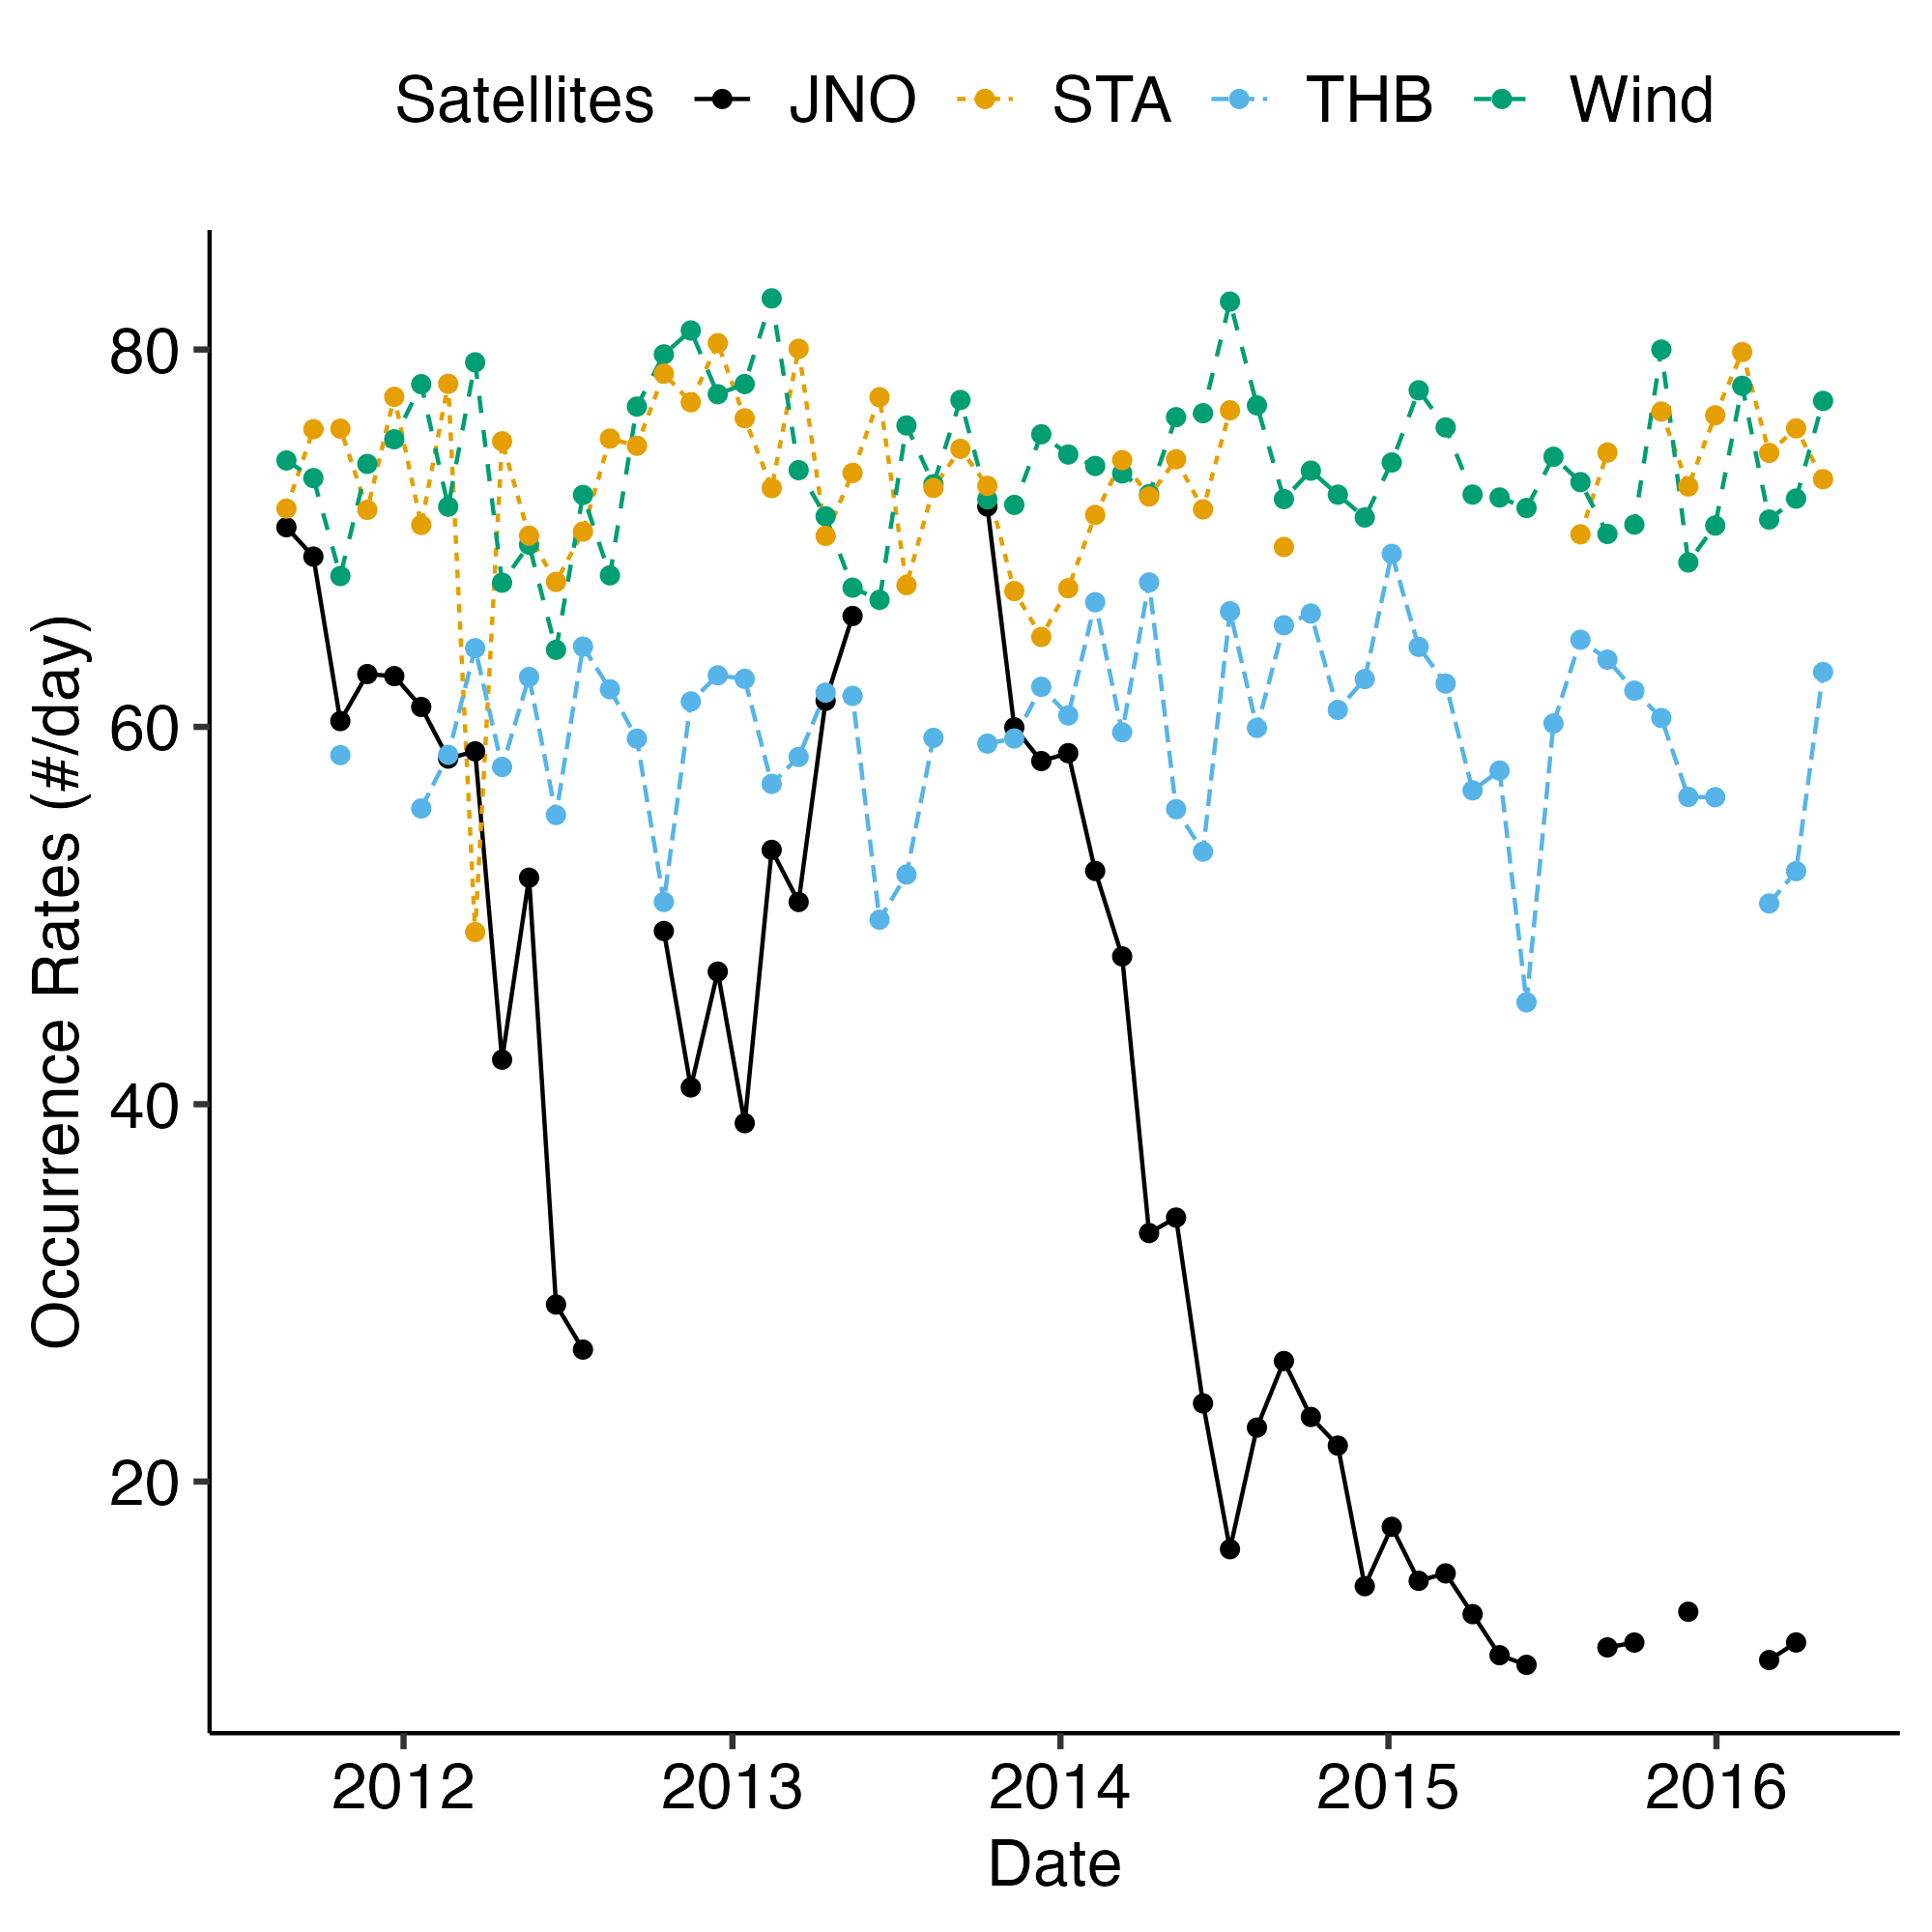
The normalized occurrence rate of interplanetary discontinuities (IDs) decreases with radial distance from the Sun, following a \(1/r\) relationship.
The thickness of IDs increases with radial distance, but when normalized to the ion inertial length, it decreases.
The current density of IDs decreases with radial distance, but when normalized to the Alfvén current, it increases.
The distribution of the normalized thickness and current density of IDs remain constant over time at 1 AU on a yearly scale.
