Setup
::: {#cell-2 .cell 0=‘h’ 1=‘i’ 2=‘d’ 3=‘e’ execution_count=9}
Code
import polars as plfrom discontinuitypy.utils.basic import load_catalogfrom beforerr.r import py2rpy_polarsimport rpy2.robjects as robjectsfrom discontinuitypy.pipelines.project.pipeline import process_events_l2from discontinuitypy.utils.polars import pl_normimport hvplot.polarsimport panel as pnimport warnings# Suppress specific FutureWarning from pandas in Holoviews "ignore" , category= FutureWarning , module= "holoviews.core.data.pandas"
:::
::: {#cell-3 .cell 0=‘h’ 1=‘i’ 2=‘d’ 3=‘e’ execution_count=2}
Code
% load_ext autoreload% autoreload 2 % load_ext rpy2.ipython= load_catalog()= robjects.r'utils.R' )= py2rpy_polars()
[11/30/23 13:28:07] WARNING KedroDeprecationWarning: 'AbstractVersionedDataSet' has been renamed to logger.py : 205 'AbstractVersionedDataset' , and the alias will be removed in Kedro
0.19 .0
WARNING R[ write to console] : The following objects are masked from callbacks.py : 124 ‘package:stats’:
filter, lag
WARNING R[ write to console] : The following objects are masked from callbacks.py : 124 ‘package:ba se’:
intersect, setdiff, setequal, union
:::
Code
= catalog.load("events.l1.ALL_sw_ts_1s_tau_60s" ).collect()= ["dB_x_norm" , "dB_y_norm" , "dB_z_norm" ]= (= pl_norm(cols))= pl.col("dB_x_norm" ) / pl.col("dB" ),= pl.col("dB_y_norm" ) / pl.col("dB" ),= pl.col("dB_z_norm" ) / pl.col("dB" ),= pl.col("dB_z_n2" ).arccos().degrees(),= (pl.col("dB_y_n2" ) / pl.col("dB_x_n2" )).arctan().degrees(),= all_events_l1.filter (pl.col("sat" ) == "JNO" )= all_events_l1.filter (pl.col("sat" ) != "JNO" )= all_events_l1.pipe(process_events_l2)
[11/30/23 13:28:08] INFO Loading data from 'events.l1.ALL_sw_ts_1s_tau_60s' data_catalog.py : 502 ( LazyPolarsDataset) ...
Code
% R - i JNO_events_l1 - c conv_pl% R - i all_events_l1 - c conv_pl% R - i other_events_l1 - c conv_pl% R - i all_events_l2 - c conv_pl
Code
%% R<- c(0.99 , 0.9 , 0.7 , 0.5 , 0.3 , 0.1 )<- function(df, x, y, type = "hdr" , facets = NULL, color = NULL) {<- ggplot(df, aes(x = .data[[x]], y = .data[[y]]) ) + = "black_first" )if (! is .null(facets)) {<- p + facet_wrap(vars (.data[[facets]]))if (type == "hdr" ) {<- p + geom_hdr_lines(= color),= probselse if (type == "density" ) {<- p + geom_density_2d_filled()return (p)
\(\theta_{n,b}\)
Code
'theta_n_b' ].describe()
shape: (9, 2)
str
f64
"count"
280740.0
"null_count"
0.0
"mean"
89.565227
"std"
24.914059
"min"
0.046898
"25%"
78.403561
"50%"
89.87696
"75%"
100.96636
"max"
179.86788
Code
%% R<- "theta_n_b" <- expression(theta["n,b" ])<- c(60 , 120 )<- plot_dist(y= y, ylab= ylab, y_lim = y_lim, y_log= FALSE)
Change of magnetic field
Code
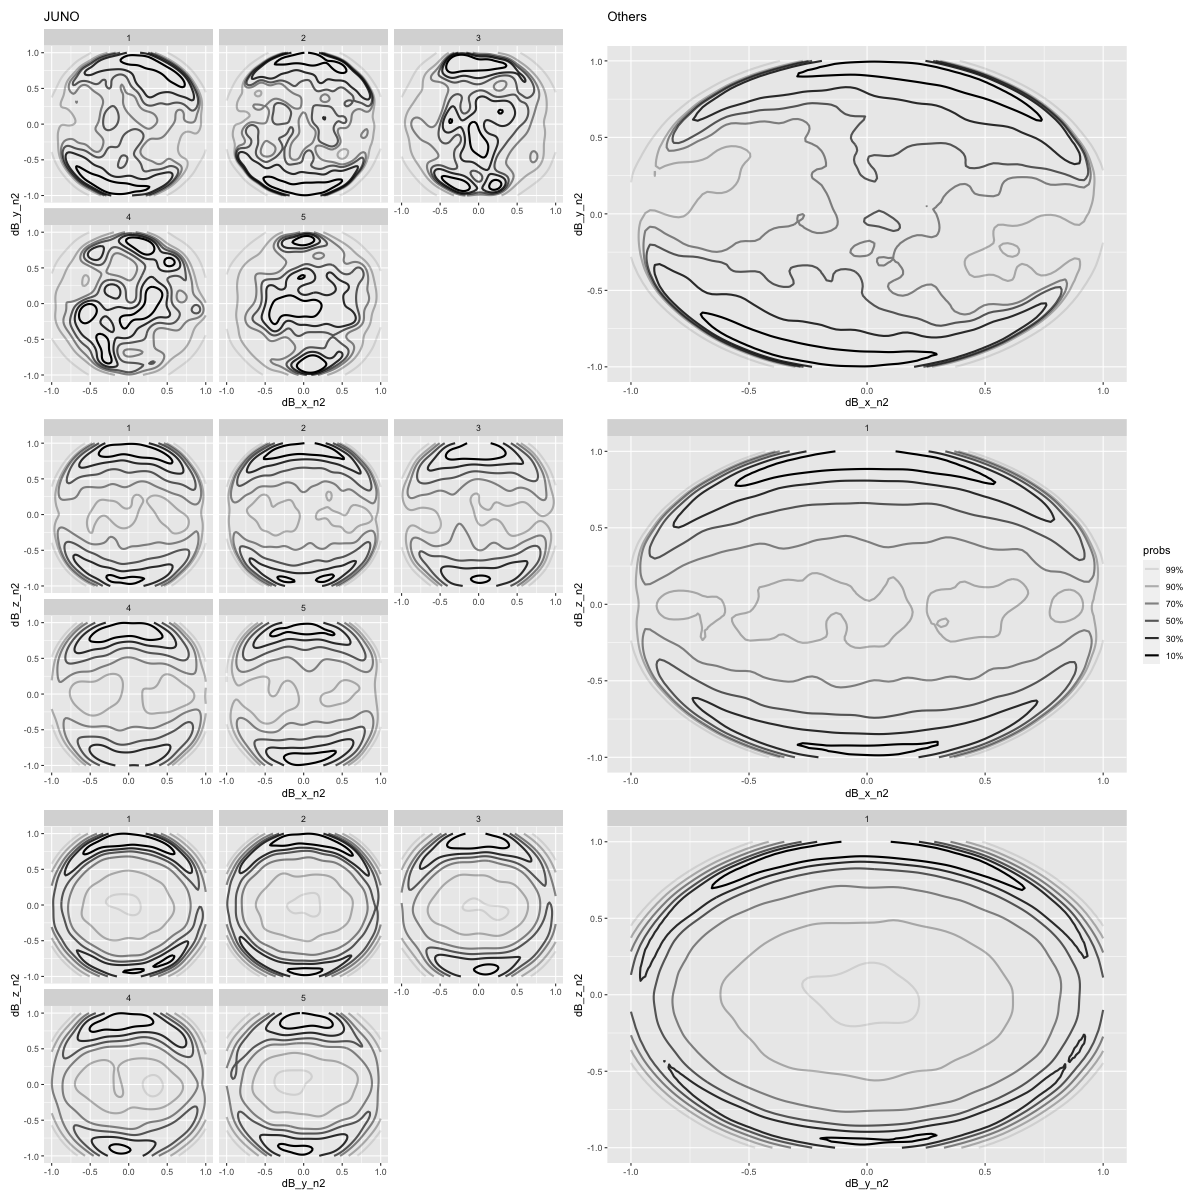
%% R - w 1200 - h 1200 <- "dB_x_n2" <- "dB_y_n2" <- "dB_z_n2" <- "r_bin" <- plot_plot(JNO_events_l1, x, y, facets = facets) + ggtitle("JUNO" ) + theme(legend.position = "none" )<- plot_plot(other_events_l1, x, y) + ggtitle("Others" ) + theme(legend.position = "none" )<- plot_plot(JNO_events_l1, x, z, facets = facets) + theme(legend.position = "none" )<- plot_plot(other_events_l1, x, z, facets = facets)<- plot_plot(JNO_events_l1, y, z, facets = facets) + theme(legend.position = "none" )<- plot_plot(other_events_l1, y, z, facets = facets) + theme(legend.position = "none" )<- (p1_JNO | p1_other) / (p2_JNO | p2_other) / (p3_JNO | p3_other)"orientation/orientation_dB_xyz" )
Saving 16.7 x 16.7 in image
Saving 16.7 x 16.7 in image
In addition: Warning message:
`aes_string()` was deprecated in ggplot2 3.0.0.
ℹ Please use tidy evaluation idioms with `aes()`.
ℹ See also `vignette("ggplot2-in-packages")` for more information.
This warning is displayed once every 8 hours.
Call `lifecycle::last_lifecycle_warnings()` to see where this warning was
generated.
Code
'theta_dB' , by= "r_bin" ,subplots= True ).cols(1 ) + JNO_events_l1.hvplot.kde('phi_dB' , by= "r_bin" ,subplots= True ).cols(1 ))
Code
'theta_dB' , by= "sat" ,subplots= True ).cols(1 ) + all_events_l1.hvplot.hist('phi_dB' , by= "sat" ,subplots= True ).cols(1 ))
Normal direction obtained from dot product
Code
def dist_plot(df: pl.LazyFrame, var, by= None ):return df.hvplot.density(var, by= by, subplots= True , width= 300 , height= 300 )
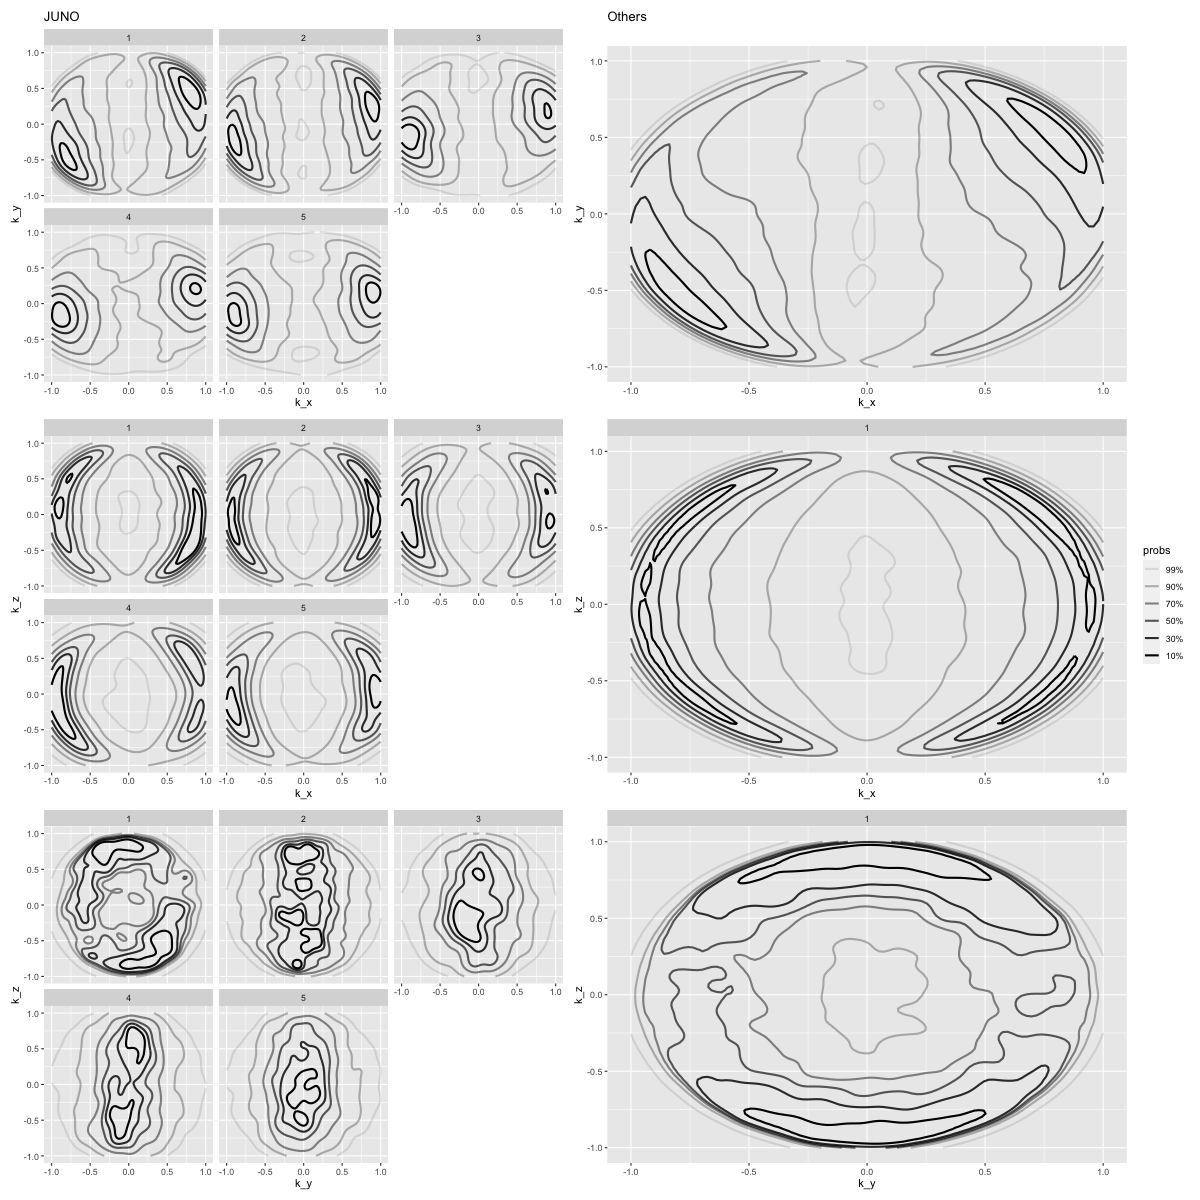
Most discontinuities has normal direction with large \(k_x\) and small \(k_y\) with evenly distributed \(k_z\) .
Code
# (dist_plot(JNO_events_l1, "k_x", by="r_bin") + dist_plot(other_events_l1, "k_x")).cols(3) + (dist_plot(JNO_events_l1, "k_y", by="r_bin") + dist_plot(other_events_l1, "k_y")).cols(3) "k_x" , by= "r_bin" ).cols(5 ) + dist_plot(other_events_l1, "k_x" ),"k_y" , by= "r_bin" ).cols(5 ) + dist_plot(other_events_l1, "k_y" ),"k_z" , by= "r_bin" ).cols(5 ) + dist_plot(other_events_l1, "k_z" ),
Code
%% R - w 1200 - h 1200 <- "k_x" <- "k_y" <- "k_z" <- "r_bin" <- plot_plot(JNO_events_l1, x, y, facets = facets) + ggtitle("JUNO" ) + theme(legend.position = "none" )<- plot_plot(other_events_l1, x, y) + ggtitle("Others" ) + theme(legend.position = "none" )<- plot_plot(JNO_events_l1, x, z, facets = facets) + theme(legend.position = "none" )<- plot_plot(other_events_l1, x, z, facets = facets)<- plot_plot(JNO_events_l1, y, z, facets = facets) + theme(legend.position = "none" )<- plot_plot(other_events_l1, y, z, facets = facets) + theme(legend.position = "none" )<- (p1_JNO | p1_other) / (p2_JNO | p2_other) / (p3_JNO | p3_other)"orientation/orientation_k_xyz" )
Saving 16.7 x 16.7 in image
Saving 16.7 x 16.7 in image
In addition: Warning message:
`aes_string()` was deprecated in ggplot2 3.0.0.
ℹ Please use tidy evaluation idioms with `aes()`.
ℹ See also `vignette("ggplot2-in-packages")` for more information.
This warning is displayed once every 8 hours.
Call `lifecycle::last_lifecycle_warnings()` to see where this warning was
generated.
\(V_l\)
Code
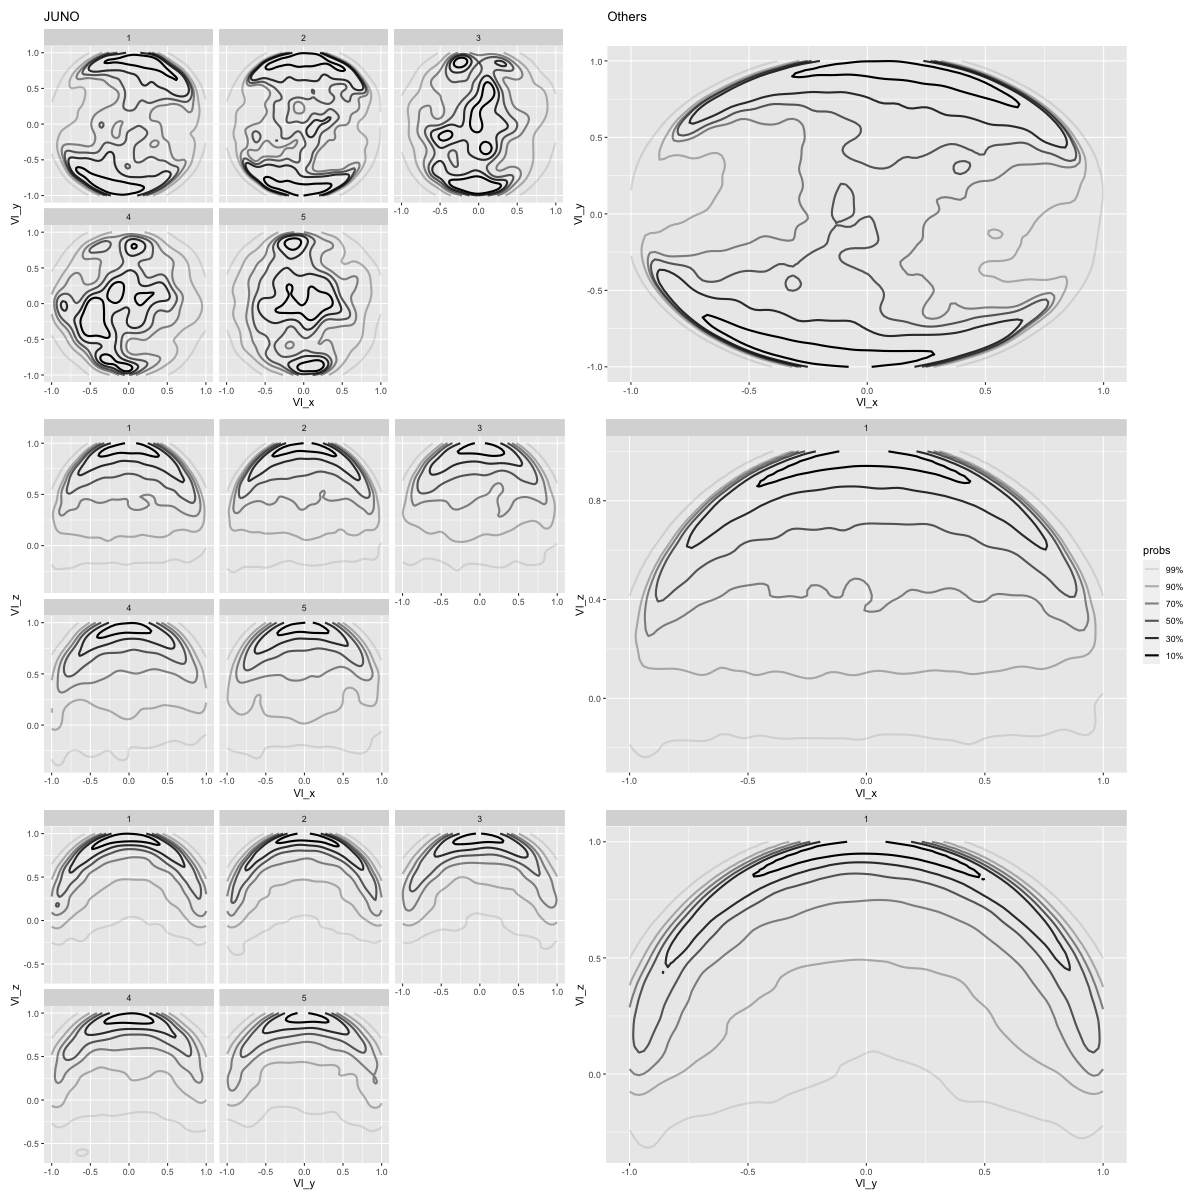
%% R - w 1200 - h 1200 <- "Vl_x" <- "Vl_y" <- "Vl_z" <- "r_bin" <- plot_plot(JNO_events_l1, x, y, facets = facets) + ggtitle("JUNO" ) + theme(legend.position = "none" )<- plot_plot(other_events_l1, x, y) + ggtitle("Others" ) + theme(legend.position = "none" )<- plot_plot(JNO_events_l1, x, z, facets = facets) + theme(legend.position = "none" )<- plot_plot(other_events_l1, x, z, facets = facets)<- plot_plot(JNO_events_l1, y, z, facets = facets) + theme(legend.position = "none" )<- plot_plot(other_events_l1, y, z, facets = facets) + theme(legend.position = "none" )<- (p1_JNO | p1_other) / (p2_JNO | p2_other) / (p3_JNO | p3_other)"orientation/orientation_Vl_xyz" )
Saving 16.7 x 16.7 in image
Saving 16.7 x 16.7 in image
Evolution
Code
%% R<- "time" <- c("k_x" , "k_y" , "k_z" )<- "Time" <- c("Orientation (k_x)" , "k_y" , "k_z" )<- plot_util(all_events_l2, x_var = x_var, y_vars = y_vars, xlab= xlab, ylabs= ylabs)"orientation/orientation_k_time" )<- "ref_radial_distance" <- "Referred Radial Distance (AU)" <- plot_util(all_events_l2, x_var= x_var, y_vars = y_vars, xlab= xlab, ylabs= ylabs)"orientation/orientation_k_r" )<- "ref_radial_distance" <- c("Vl_x" , "Vl_y" , "Vl_z" )<- "Referred Radial Distance (AU)" <- c("Orientation (l_x)" , "l_y" , "l_z" )<- plot_util(all_events_l2, x_var= x_var, y_vars = y_vars, xlab= xlab, ylabs= ylabs)"orientation/orientation_l_r" )
Saving 6.67 x 6.67 in image
Saving 6.67 x 6.67 in image
Saving 6.67 x 6.67 in image
Saving 6.67 x 6.67 in image
Saving 6.67 x 6.67 in image
Saving 6.67 x 6.67 in image
In addition: There were 30 warnings (use warnings() to see them)
Code
%% R<- "radial_distance" <- "k_x" <- NULL<- 16 <- 32 <- "Radial Distance (AU)" <- "Orientation (k_x)" <- plot_binned_data(JNO_events_l1, x_col = x_col, y_col = y_col, x_bins = x_bins, y_bins= y_bins, y_lim = y_lim, log_y = FALSE)<- p + labs(x = xlab, y= ylab)"orientation/orientation_kx_r_dist" )
Saving 6.67 x 6.67 in image
Saving 6.67 x 6.67 in image


